Quick-and-Dirty Guide to the TI-83, TI-83+, TI-84, and TI-84+
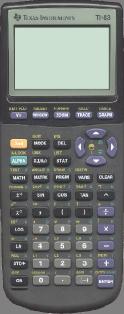
To the left is a picture of a TI-83 calculator. (The TI stands for Texas Instruments.) The TI-83 "Plus", TI-84, and TI-84 "Plus" are almost identical, so this guide will serve just as well for them. The TI-89 and TI-92 are significantly different, and this guide probably won't be much use for them.
The TI-83, 83+, 84, and 84+ are "graphing calculators." This means they can graph, but it also means a good deal more than that: they work very differently from older, "scientific" calculators. For instance, if you want to find the square root of 2 on an older calculator, you hit 2 and then  . But with a graphing calculator, you type (2). In general, you almost always type equations the same way you would write them.
If you have to buy a calculator for school, and you don't want to spend all that money buying something you only need for a short time, check out My Calculator Rental at www.mycalcrental.com. They are not paying me for this link: I just think it's a great service!
Click here for my guide to the NumWorks calculator, which offers similar functionality but (in some ways) significantly better, and for a better price. And by the way, they're not paying me to say that either, but they will give you a free calculator if you're a high school math teacher who is willing to give their calculator a try!
The Basics
The phrase "the basics" is a bit misleading here. If you've never used a calculator before, and you're not terribly comfortable playing around with new technology, this will not be basic enough for you. You need explanations of how to do simple math operations, how to turn it on and off, how to use the ENTER key, and how to use CLEAR or DEL, and I'm not providing any of that. But if you are used to calculators other than this model of TI, this is the right place to start. Even veteran TI users sometimes get confused about order of operations issues, or don't know about wonderfully useful keys such as ANS, and this may really help. Of course, as you're reading, you should actually do this stuff on your calculator!
Order of Operations
The beauty, and the danger, of these calculators, is that they respect order of operations completely. In almost all cases, you can type something the way that you would write it. For instance, you can type 5+3log(100)/2 and hit ENTER. The calculator knows that you intend to multiply the 3 by the log (although you never said so explicitly); and it knows that it should perform the log first, then the multiplication and division, and finally the addition. So it comes up with the correct answer, 8.
Here's where this can get you into trouble. Suppose you are solving a quadratic equation, and you want to enter this equation:
So you, being vigilant and careful about parentheses, would naturally type: (-10+(102-4*2*12))/2*2. One set of parentheses holds everything inside the square root, and the outer set holds the entire numerator of the fraction. Given all that care, you might be very surprised when you hit ENTER and got the wrong answer. What happened?
The answer is, the denominator. You ended by saying /2*2. Since division and multiplication are at the same level in the order of operations, the calculator will group them left to right: first it will divide by 2, and then it will multiply by 2. Not what you wanted. You need to parenthesize the denominator as well, as follows:
(-10+(102-4*2*12))/(2*2) ENTER
This gives the answer you expected (-2).
That may seem like an odd way to begin a tutorial, but that specific problem—failure to parenthesize multiplied terms in the denominator—leads to more problems than anything else I've seen.
With the TI-connect software, you can download the latest version of the operating system 2.55 MP, and then select the "Mathprint" option (under "Mode"), which allows you to enter fractions in a much more visual way that avoids this problem. I've never used this feature myself, and I'm not sure if it works on all models or only on the TI-84+, but it sounds like a Godsend to those who have it.
As a final note, another easy way to mess up this particular calculation is to confuse the two minus keys: both must be used in the correct places. See below for an explanation of the distinction.
Yellow, Green, and Storing Numbers
A typical key on the calculator looks like this:

This key can be used for three separate functions: the one written in white on the key, the one written in yellow above the key, and the one written in green above the key.
| Hit this key, and you get: |
|
Hit the yellow button labeled 2nd and then hit this key, and you get: |
|
Hit the green button labeled ALPHA and then hit this key, and you get: |
| sin |
|
sin-1 |
|
E |
OK, but what is an E anyway? It is a named memory space. Using the  key, you can put a number into memory E.
Here's an example. Suppose that, for some reason, the number (5)*(p-2) keeps showing up in your calculations. (Hey, it could happen.) You need to add one to it, you need to double it, all kinds of things...and you don't want to keep typing it! So you type:
(5)(p-2) ALPHA SIN
(Note: where do you find p? It's in yellow: you get it by hitting 2nd and then ^.)
What does all that do? It performs the calculation you wanted, and then stores the result in the memory space called E (since the E is in green above the SIN key). Thereafter, you can use ALPHA SIN to get an E and use it in calculations such as:
E+1
2E
(E)+E2
...or whatever, you get the idea.
Every letter from A to Z is a different memory, and can hold a different number. Note, however, that the letter X is used for special purposes. Because it is so special, there is a shortcut: instead of hitting ALPHA and then —which will work to get an X but takes two keystrokes—you can get an X with only one keystroke, by hitting the button labeled X,T,q,n.
Menus, and Stupid Trig Tricks
A lot of option-setting is done through menus, and the way they work can be confusing at first. I'm going to use a common trig problem to illustrate the way menus work.
Let's say you're new to trig, and you've just learned that sin(30o)=½. You type sin(30)ENTER and get the ugly-looking answer -.9880316241. What you've just discovered is that the calculator is in radian mode which is its default, and you've never even heard of radians, and you want degrees back. Here's what you do.
- Hit MODE. This brings up a menu with a bunch of options you can change.
- Use the down arrow until the blinking cursor is on Radian.
- Use the right-arrow to move it to Degree. This is the tricky part, because it looks like you've done something, but you haven't done anything yet!
- Hit ENTER. That actually puts the calculator in Degree mode.
- Finally, use 2nd QUIT to return to the main screen. After that, the sin of 30 will come out the way you expect it to.
The Two Minuses
The key marked (-), down next to the ENTER key, makes the number after it negative. The key marked - above the + key subtracts the number after it, from the number before it. Hence, you can type:
3-(-)3
and the calculator will subtract -3 from 3, and give you 6. If you confuse the two minuses, you will generally get a syntax error.
ENTRY
Above the ENTER key, in yellow, is the word ENTRY. As discussed above, you use this function by first hitting the yellow 2nd key, and then hitting ENTER.
What ENTRY does is brings back your previous command. You can then tweak it and run it again a little differently. For instance, in one example above, you typed the following to find one root of a quadratic equation:
(-10+(102-4*2*12))/(2*2)
To find the other root, you need to type the exact same equation again, but change the + to a -. Instead of typing the whole thing again, hit ENTRY to bring it back, and then just go change that one character and hit ENTER to re-run the calculation.
Hitting ENTRY several times in a row steps through your last few commands.
ANS
Above the (-) key, in yellow, is the word ANS. As discussed above, you use this function by first hitting the yellow 2nd key, and then hitting (-).
ANS is a variable that refers to the last answer the calculator got. This is useful in a lot of situations, but particularly when you want to do something iteratively. For instance, suppose you start with $10, and triple it every year. (Good job!) How much money do you have every year? Start by typing:
10 ENTER
The calculator calculates 10 and comes up with the answer, 10. Not much fun, was it? But 10 is now loaded into the ANS variable. Next, type:
3ANS ENTER
The calculator multiplies 3 by ANS and comes back with 30. Still not very exciting, is it? But wait: now, just start hitting ENTER again—and again—and watch what happens.
The answers start spilling out, one by one, as if by magic. What's going on? Every time you hit the ENTER key, the calculator re-executes the last command, which was 3ANS. But each time, ANS is updated to be the previous answer, so each new answer is three times the old one.
This feature is very useful when dealing with "recursive" functions. In AB Calculus, we use it when doing Newton's Method.
Memory clearing (the cure-all)
Sometimes, your calculator gets into a funny mode. Maybe your sister was using it, and she set it to do parametric equations, and you have no idea what that means but you do know that it isn't behaving normal. Whenever students come to me and complain that the calculator is acting funny, here's what I do.
- Hit MEM (you do this by hitting the yellow 2nd key, and then hitting +).
- This brings up a menu. Use the down arrow key to scroll to the word RESET and hit ENTER.
- You are now asked if you want to reset "all memory" or just "defaults." Either one will generally work. The former is stronger, but it also clears out any games you may have downloaded.
- You are now asked if you really want to do this. Tell it that yes, you really do.
This returns your calculator to a sort of pristine virgin state. I don't know what was wrong with it before, but it should be gone now.
If that doesn't work, try dumping the batteries and the backup lithium battery, waiting for a minute or so, and then putting them back.
Return to the top menu
Graphs and Tables
This is, of course, the feature that gives the "graphing calculator" its name! You can type functions into the calculator, and then look at those functions visually (graph) or numerically (table).
1. Hit Y= (blue button on the top row). This takes you to the screen when you enter functions.
2. Now, type a function: say, X2-2. Let me say a few words about how you enter such an equation.
- To hit X you can hit ALPHA just as you would enter any other variable. But because this is so common, the TI provides a button that does it more quickly: the button labeled X,T,q,n. Hitting that button is a quick easy way to enter an X.
- To get X2, you could hit X^2, but it's easier to hit the X and then the X2 keys; and the resulting display looks nicer too. (*Trivia: you can also get a nice "cube" by hitting MATH 3.)
- Finally, be careful as always about order of operations! cos(x)/2x will take cos(x), divide it by 2, and then multiply it by x. What you probably meant was cos(x)/(2x).
The screen should now look something like this:
Now...
3a. To see a graph, hit GRAPH (another blue button on the top).
|
or... |
3b. To see a table of values, hit TABLE (in yellow above GRAPH, so you hit 2nd and then GRAPH).
|
Finally, you can always use 2nd QUIT to return to the main screen—from the Y1 menu, from a graph, from a table, or anywhere else.
The graphing window
By default, graphs are displayed in a window where -10<X<10, and -10<Y<10. There are a couple of ways you can change the viewing screen.
While looking at a graph, you can hit the ZOOM key. This brings up a menu where you can zoom in, or zoom out, or other things. One thing that confused me at first: when you choose "zoom in" it returns you to the graph, but does not zoom in. Then you hit ENTER and it zooms in. The reason is that it is giving you a chance to choose (by using the arrow keys) what point it should zoom in on. In other words, it is re-centering as well as zooming.
When I first started using the calculator, I used ZOOM to zoom in and out all the time. Now I find this is something I rarely do. Instead, I take more direct control by hitting WINDOW.
- Hit WINDOW (one of the blue keys at the top).
- Set Xmin and Xmax to set the domain of the graph: for instance, if the Xmin=0 and Xmax=100 then the horizontal axis goes from 0<X<100.
- Set Ymin and Ymax similarly for the range. Note that they may be completely different: you might set Ymin=-1 and Ymax=1, even while X is going from 0 to 100. This produces a very distorted graph, but there are sometimes very good reasons for doing so.
- There are also a bunch of other options in WINDOW, such as Xscl and so on. I always ignore them.
- Anyway, when you hit GRAPH you see a graph in the newly defined window.
As a final note, you can always hit ZOOM 6 (which chooses the option called ZStandard) to return to the default viewing window.
Tweaking a graph
The Y1, Y2 thing enables you to look at many different graphs simultaneously. But it can get confusing to see which is which. Try the following.
- Hit Y= to get to the graphing screen.
- Type a function into Y1 (in the example below, I use Y1=X2-2)
- Hit the down arrow to edit Y2
- Type a function into Y2 (in the example below, I use Y2=2X)
- Now, still on Y2, hit the left arrow key until the blinking cursor is on the little backslash that you never noticed to the left of Y2
- Hit ENTER. The backslash becomes boldfaced (changes from \ to \). This means that the function will be graphed in boldface.
- Finally, hit GRAPH. The resulting display is shown below. Note that the parabola is drawn regular, and the line boldface.
As a final experiment: hit Y= and navigate your way back to the backslash. Now start hitting ENTER a few more times, and you will see different options for how this particular graph can be drawn. I don't know what they all mean, but the little circle with a line on its left is pretty cool: it draws the function slowly, while you watch.
Table values
By default, when you create a table of values, the table starts at X=0 and then moves on to X=1, X=2, and so on. You can see this behavior in the sample table shown above.
But just as you can change the window of a graph, you can change the values used in a table. Hit TBLSET (in yellow above the WINDOW key). Just like the WINDOW screen, this has a few options that I never use. The two that I do use are TblStart and DTbl. These control the X-values used in your table. For instance, set TblStart=100 and DTbl=5 and your table will use X values 100, 105, 110, and so on.
Graphing in polar coordinates
- Hit the MODE key.
- Arrow down to where it says Func (short for "function" which is a bit misleading since they are all functions).
- Now, use the right arrow to choose Pol.
- Hit ENTER. (*It's easy to forget this step, but it's crucial: until you hit ENTER you have not actually selected Pol, even though it looks like you have!)
The calculator is now in polar coordinates mode. To see what that means, try this.
- Hit the Y= key. Note that, instead of Y1=, Y2=, and so on, you now have r1= and so on.
- In the r1= slot, type 5-5sin(
- Now hit the familiar X,T,q,n key, and you get an unfamiliar result. In polar coordinates mode, this key gives you a q instead of an X.
- Finally, close off the parentheses and hit GRAPH.
If you did everything right, you just asked the calculator to graph the polar equation r=5-5sin(q). The result looks a bit like a valentine.
The WINDOW options are a little different in this mode too. You can still specify X and Y ranges, which define the viewing screen. But you can also specify the q values that the calculator begins and ends with; for instance, you may limit the graph to 0<q<p/2. This would not change the viewing window, but it would only draw part of the graph.
Graphing parametric equations
- Hit the MODE key.
- Arrow down to where it says Func (short for "function" which is a bit misleading since they are all functions).
- Now, use the right arrow to choose Par.
- Hit ENTER. (*It's easy to forget this step, but it's crucial: until you hit ENTER you have not actually selected Par, even though it looks like you have!)
The calculator is now in parametric equations mode. To see what that means, try this.
- Hit the Y= key. Note that, instead of Y1=, Y2=, and so on, each graph is now specified by two different functions. For instance, the first graph is specified as X1T and Y1T.
- In the X1T slot, type 5(cos(
- Now hit the familiar X,T,q,n key, and you get an unfamiliar result. In parametric mode, this key gives you a T instead of an X.
- Hit two closing parentheses, )) since you used two opening parentheses earlier.
- Hit MATH 3 to get cubed. You should now have X1T=5(cos(T))3. But you do not have a complete function you can graph yet, since a parametric equation requires two functions!
- Hit the down arrow to go to Y1T and in that space type the same formula, but with a sin instead of a cos.
- Finally, hit GRAPH.
If you did everything right, you just asked the calculator to graph the parametric equations x=5cos3t, y=5sin3t. The result looks a bit like a diamond, with all four edges bowed inward.
The WINDOW options are a little different in this mode too. You can still specify X and Y ranges, which define the viewing screen. But you can also specify the T values that the calculator begins and ends with; for instance, you may limit the graph to 0<T<3. This would not change the viewing window, but it would only draw part of the graph.
Curve fitting, or regression
"Regression" is a peculiar word that means you have a bunch of points, and you want to find a particular curve that most closely fits them. (For instance, you have done an experiment, and are now looking for the function that best models your data.)
- Hit STAT to go into the Statistics menu.
- Choose Edit... This brings you to a screen where you enter a bunch of L1 and L2 values
- Enter the L1 and L2 values as follows: for each data point, the x-coordinate is in the L1 list, and the y-coordinate is in the L2 list.
 This screen shows the points (2,1), (4,3), and (5,8).
- Hit 2nd QUIT return to the main screen.
- Hit STAT to return again to the Statistics menu.
- Hit the right-arrow key to go to CALC.
- At this point, you have several choices. LinReg will give you a line that best fits your points. QuadReg will give you a quadratic function, aka a second-order polynomial. There are also options for "cubic" (third-order polynomial), "quartic" (fourth-order polynomial), logarithmic, or exponential curves. Choose the one you want and hit ENTER.
The calculator does not graph your curve for you, but it does tell you what the curve is. For instance, if I run a QuadReg on the data above, the calculator gives me:
This tells me that the best quadratic fit for my data is the curve y=1.33x2-7x+9.67.
Remember that whatever option you choose, it will operate on the points you have entered in the L1 and L2 lists, so make sure your data is correctly entered there!
Is a quadratic function a reasonable guess for those three points? One way to guess would be to look at the points. Once they are entered in the L1 and L2 lists, looking at the points is easy.
- Hit Y= (upper-left-hand corner of the calculator).
- Then, hit the up-arrow key, so the focus moves to Plot1 (which will start blinking).
- Hit ENTER. It's actually impossible, at this point, to see that anything has happened. But if you down-arrow away from Plot1, you should see that it remains darkened (white letters on a black background, instead of the other way around). This indicates that it has been selected.
- Hit GRAPH (upper-right-hand corner of the calculator). The calculator now displays the points. From the image below, you can see that a quadratic (parabolic) or exponential function might be a reasonable guess, whereas a line or logarithmic function would be unlikely to fit.
(Note: don't see the points you're looking for? You may have to reset the Window!)
There's just one more thing you have to know—once you've done this once, how do you clear out the lists to enter new ones? Here is one way to do it.
- Hit MEM (you do this by hitting the yellow 2nd key, and then hitting +).
- This brings up a menu. Choose ClrAllLists.
- Then—after you return to the main screen—hit ENTER and the lists are emptied out.
Return to the top menu
Calculus & Advanced Stuff
Derivatives
This calculator cannot tell you that the derivative of x2 is 2x. (Some more advanced calculators can.) But it can tell you that the derivative of x2 evaluated when x=3 is 6.
- Hit the MATH key. This takes you to the MATH menu.
- Scroll down until the cursor is on nDeriv( and hit ENTER
or
Instead of scrolling around, you can just hit the number 8 since nDeriv( is option #8.
- Type X2,X,3)
- Hit ENTER
If you did everything right, you just executed the instruction nDeriv(X2,X,3). Read this as "the derivative of X2, with respect to X, evaluated when X=3." The calculator comes back with 6.
Important note: the calculator is using numerical approximation techniques to find derivatives. In some cases, those techniques will not work, and you will get an answer that is just plain wrong. Caveat emptor.
Definite integrals
This calculator cannot tell you that the integral of 2x is x2+C. (Some more advanced calculators can.) But it can tell you that the integral of 2x evaluated between x=1 and x=4 is 15.
- Hit the MATH key. This takes you to the MATH menu.
- Scroll down until the cursor is on fnInt( and hit ENTER
or
Instead of scrolling around, you can just hit the number 9 since fnInt( is option #9.
- Type 2X,X,1,4)
- Hit ENTER
If you did everything right, you just executed the instruction fnInt(2X,X,1,4). Read this as "the integral of 2X, with respect to X, evaluated as X goes from 1 to 4." The calculator comes back with 15.
Important note: the calculator is using numerical approximation techniques to find integrals. In some cases, those techniques will not work, and you will get an answer that is just plain wrong. Caveat emptor.
Solving equations
The TI has a built-in "solver" that finds answers to algebra problems.
First of all, the only equations the calculator can solve are of the form some function=0. This sounds like a limitation, but it's not, because any algebra problem can be recast that way. For instance, if you want to find out where cos(x)=x, you simply rewrite the problem as cos(x)-x=0. Now, let's see how we would approach that problem.
- Hit the MATH key. This takes you to the MATH menu.
- Scroll down until the cursor is on Solver... and hit ENTER
or
Instead of scrolling around, you can just hit the number 0 since Solver... is option #0.
Here's where the step-by-step-instruction thing becomes a little tricky. Because there are two different solver screens, and which one you land on depends on whether you have ever used the solver before.
You may end up on a screen like this: let's call it solver screen 1.
"Solver screen 1": equation on top, X=some number below that, and BOUND and left-rt thingies below that.
The equation on top is the last equation anyone used the solver for, and it is probably not the equation you want. So, you need to change that equation before you do anything else.
- Hit the up arrow key. It looks like this will just move the cursor up, but actually the whole screen changes.
- Hit CLEAR to erase the function that was previously there.
Now—either because you just never used the solver before, or because you just used the up arrow and CLEAR, you are now in what I call (you guessed it) solver screen 2.
- Type your function. In our example, you would type cos(X)-X.
"Solver screen 2": says EQUATION SOLVER in big letters, and below that says 0= and then your function.
- Hit ENTER. This takes you back to...solver screen 1! And this is the trickiest moment. The equation you want is displayed on top, and below that it says X=some number, and it looks for all the world like it has solved your equation. But in fact, it hasn't done anything yet.
- Type a number into the X= place. This number tells the calculator where to start looking for a solution. For instance, if you type 4, the calculator will start looking in the vicinity of X=4 for a solution to the equation.
- Hit ALPHA and then hit the ENTER key. As you know, this combination executes the command in green above the ENTER key, which is SOLVE. Now, the calculator actually solves your equation, and puts its new answer into the X= spot.
Whew! That's a lengthy process to explain. But once you've done it a few times, it's actually a very quick process to execute. And incidentally, if you want to use the answer you have found in a subsequent calculation, you don't need to retype it; after the solver finishes its work, the answer has been stored as X.
But the solver does have one very important limitation, which is that it only finds one answer. Many algebra equations have two answers (or three or four or a hundred); the calculator will generally find the one that is closest to the initial value you gave it in step (7). For this reason, when I really want to solve something thoroughly, here is what I usually wind up doing:
- Use graphs to find how many solutions there are, and roughly where they are.
- Use the solver once, giving it a starting value near one of the solutions. The solver will give you an exact solution.
- Now use the solver again, giving it a different starting value that is near a different solution.
- Repeat as necessary.
Minimum and Maximum
You spend a lot of time in Calculus finding minima and maxima of curves. The calculator can do it for you.
- Enter Y1=X2-2 and then hit GRAPH.
- Now, while you are looking at the graph, hit 2nd CALC (just above TRACE) and choose minimum.
- The calculator asks for a left bound: type -5 ENTER
- The calculator asks for a right bound: type 5 ENTER
- The calculator asks for a guess: type 4 ENTER.
The calculator then finds the minimum for you. Now, even if you've never taken Calculus, you probably know that the actual minimum of this curve occurs when X=0. The calculator comes close, but not exactly on, with its answer of 9.296*10-7. It's important to learn to look at such answers and recognize them for what they are: more or less, zero.
The min/max function uses much the same process—and with the same limitation—as the Solver. It starts with your initial guess, and looks for a minimum near there. If there is more than one minimum, you will need to repeat the process using a different initial guess.
Tangent line to a curve
Finding the tangent line to a curve is a common AP problem. It is also useful as a "linear approximation" of the curve near a point.
- Enter Y1=X2-2 and then hit GRAPH.
- Now, while you are looking at the graph, hit 2nd DRAW (just above PRGM) and then choose Tangent.
- You are returned to the graph, and nothing happens at all: the calculator is waiting for you. Type 3 ENTER.
At this point, the calculator draws the tangent line to the graph at X=3, and also displays the equation for that line, y=6x-11.
Return to the top menu
Miscellany
Absolute Value
Hit MATH to get to the math menu. Then hit the right arrow key, to move over to the NUM menu. In that menu, choose abs(.
Factorial
Hit MATH to get to the math menu. Then hit the right arrow key several times, to move over to the PRB menu. In that menu, choose !.
The Vars Key ("variables")
This one doesn't come up very often for me. But when it does, it's pretty cool. The VARS key gives you a way to refer specifically to the functions that you have entered into the calculator.
Let's start off with a trivial example.
- Hit Y=
- Type X2-2 into the Y1= slot
- Hit 2nd QUIT to return to the main screen
- Hit the VARS key
- Hit the right arrow to go to Y-VARS
- Hit 1 to choose Function...
- Hit 1 to choose Y1. You are now returned to the main screen, with Y1 to show for all your trouble.
- Type (9) (*yes, the parentheses are important!) and hit ENTER
If you did it all correctly, the screen now says Y1(9) and the answer is 79. The parentheses in this case are being used as standard function notation: if Y1=X2-2, then of course, Y1(9)=79.
Seems like a lot of work for a small result, doesn't it? But you can use this anywhere. For instance, you could go to the Solver and enter the equation Y1-Y2=0 to find where two equations meet. Or, you could define Y2 as 3Y1. But, if you're up for it, let's walk through something a bit trickier.
- Hit Y= to return to the Y= screen. You should still have Y1=X2-2.
- Hit the down arrow to go to Y2. (If something is already in Y2, hit CLEAR to get rid of it.)
- Hit MATH 8 to get nDeriv (as described above).
- Enter Y1 the same way we did in the previous example (VARS right-arrow 1 1).
- Type ,X,X) to finish up Y2 (read, "Y2 is the derivative of Y1 with respect to X, evaluated at X.")
- So you can distinguish the two graphs, make the second one boldfaced (as described above).
- Finally, hit GRAPH. Below are the screen you create, and then the graph that results.
 |
|
|
| this... |
|
...leads to this |
If you know Calculus, you understand why the boldfaced line is the graph of Y=2X. But the calculator never did that computation. It's just finding the derivative of Y1 at every point, and plotting that derivative as Y2.
Matrices
I discussed earlier (under "Yellow, Green, and Storing Numbers") the fact that the calculator has twenty-six named memory slots, each capable of holding a number: for instance, you can store the number 1.4 into the memory slot G (in green above the TAN key), and then use G in formulas.
The calculator also has memory slots—ten of them—set aside for matrices. These are also named with letters, but with brackets: [A], [B], and so on through [J].
Let's step through some sample work.
- Hit the MATRX key. (On the TI-83, this is a key all to itself; on the TI-83+, it is in yellow above another key.) This brings you to a menu with a list of all the matrices.
- Use the right-arrow twice to move over to EDIT since your intention is to create a matrix.
- Type a 1 for matrix [A].
- Hit 3 ENTER 3 ENTER to indicate a 3x3 matrix.
- Now start hitting numbers, willy-nilly. If you want to reproduce the exact picture I have below, you would hit 2 ENTER 5 ENTER (-)2 ENTER 3 and so on. Keep hitting numbers and ENTER until you've filled the matrix.
- Hit 2nd QUIT to return to the main screen. The matrix you created is now stored as [A] and you can refer to it as such.
- Type 2 and then hit MATRX 1, so the main screen says 2[A]. Then hit ENTER. You have now asked for 2[A]. If you copied my matrix above exactly, you get this:
- Type MATRX 1 and then hit the X-1 key. Now the calculator says [A]-1. Hit ENTER and you will get the inverse of matrix [A].
- Hit MATRX.
- Hit the right arrow once, to go to the MATH submenu.
- Hit 1 to choose det(.
- You are now returned to the main screen, with det( typed in. Now, hit MATRX again, and then hit 1. Finally, finish the formula with a closing parenthesis. The screen should now say det([A]). When you hit ENTER you get the determinant of matrix [A].
You see the idea? [A] is a variable, and you use that variable in equations. Unlike regular variables, this is a matrix instead of a numbers. Like regular variables, you can embed this variable in arbitrarily complicated equations. You will get errors if you do illegal matrix operations (such as taking the inverse of a non-square matrix, adding two matrices with different dimensions, etc). But as long as your matrices fit the operations, the calculator can do wonders. To take a few examples:
- 2[A]+[B]-1[C] will produce one matrix which is [A] doubled, and another matrix which is the inverse of [B] multiplied by [C], and then add the two. (Of course, only the final result would be displayed to you; the intermediate matrices are computed but never shown.)
- det([A])[B] would take the determinant of A, and multiply it by [B], producing and displaying a new matrix; whereas...
- det([A][B]) would multiply [A] times [B] and then take the determinant of the resulting matrix, producing and displaying a number.
- The computation [A]-1[B] is often used when solving simultaneous linear equations.
Return to the top menu
That's it?
Of course not. What I've included here is only the tip of the iceberg. I personally only understand and use a small fraction of what these calculators can do.
But what I have included here are all the things that I use all the time in my classes. If you understand all this, you should know everything you need up through BC Calculus. And if you have something else you want to know, drop me an email at KenFe@HotMail.com and I'll reply to you and/or add it, if I know the answer!
 Gary and Kenny Felder's Math and Physics Help Home Page
www.felderbooks.com/papers
 Send comments or questions to the author