The function spectra() calculates several spectra for
the output fields. The function begins by performing a Fourier
transform on the field and derivative grids, thus generating
lattices of Fourier values ![]() and
and ![]() . At each gridpoint in
Fourier space the function then calculates
. At each gridpoint in
Fourier space the function then calculates
![]() ,
,
![]() ,
, ![]() , and
, and ![]() . The formulas for the
occupation number
. The formulas for the
occupation number ![]() and the energy spectrum
and the energy spectrum ![]() are given
below.
are given
below.
The spectra() function doesn't output these values for each
grid point, but rather groups them into bins. The size of the bins is
determined by the lattice spacing ![]() . This means for example that in
three dimensions the
. This means for example that in
three dimensions the ![]() bin (
bin (![]() ) includes only the point
) includes only the point
![]() while the next bin (
while the next bin (
![]() ) includes the
) includes the ![]() neighboring points. In one dimension there should be one point per
bin. The four quantities listed above are each averaged over each bin.
neighboring points. In one dimension there should be one point per
bin. The four quantities listed above are each averaged over each bin.
The output of this function is in several files. The first,
spectratimes_ext, simply lists the times at which
spectra were recorded. There is also one file per output field
that contains the spectra. These files are called
spectra![]() field_number
field_number![]() _ext. They contain seven
columns listing, for each bin,
_ext. They contain seven
columns listing, for each bin, ![]() , the number of points in the
bin,
, the number of points in the
bin, ![]() ,
,
![]() ,
,
![]() ,
, ![]() ,
and
,
and ![]() . (The quantities
. (The quantities ![]() ,
, ![]() , and
, and ![]() are
defined below). Note that the four spectra (the last four columns)
are calculated at each point on the lattice and then averaged for
the bin, whereas
are
defined below). Note that the four spectra (the last four columns)
are calculated at each point on the lattice and then averaged for
the bin, whereas ![]() and
and ![]() are given for the bottom of
the bin.
are given for the bottom of
the bin.
At each time for which spectra are recorded the spectra() function will write one row for each bin into each of the spectra files. When examining the output it's easy to tell where one time ends and another begins because the frequencies (first column) will monotonically increase at each time and then reset to zero when a new spectrum begins.
The number of points in each bin is given to make it possible to take
sums of different quantities over the lattice. For example Parseval's
theorem for a discrete Fourier transform states
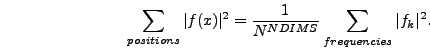 |
(5.4) |